

Notes on Child Health Cost Savings from Physical Activity
Abbreviations
K-12: Kindergarten through 12th grade. PA: Physical Activity. MVPA=Moderate-to-Vigorous Physical Activity, e.g., after several minutes, children are panting, starting to sweat, & having trouble conversing while moving. BH=behavioral/mental health.
Formula
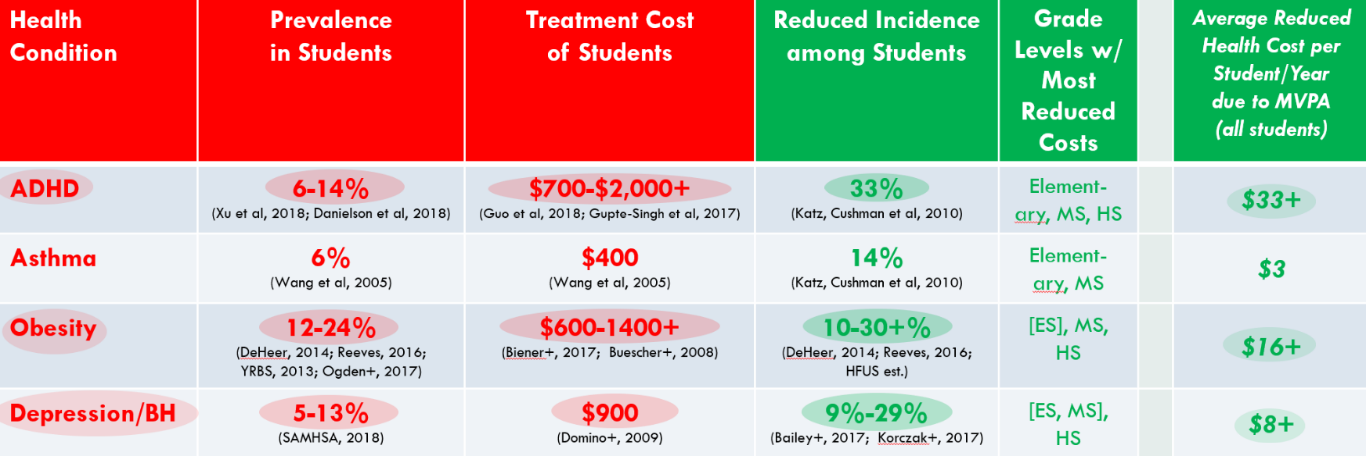
Payback/ROI formula: Condition Cost x Condition Prevalence x Reduced Incidence of Condition = Treatment Cost Reduction per Average Student (across all students, not just those with health conditions, since most students are at-risk and since the program is implemented across all students).
Targeting total minimum of 60 minutes/day of MVPA from before, during and after school activities, per National Academy of Sciences/Institute of Medicine recommendations.
$ and % range estimates based on conditions with biggest impact on cost at given ages.
General
Studies indicate that approximately 1 in 3 of ADHD child cases (Katz et al, 2010) and 1 in 4 teen depression cases (Bailey et al, 2017) can improve particularly quickly. Reduced ADHD incidence/cost is for common/moderate ADHD not more serious/complex cases. (Notes on effect size interpretation, Faraone, 2008.)
Also, BMI has improved within 1-2 years with regular MVPA in both Partners for Healthy Promises and Fit Kids at School—with possible assistance from school meals being improved over the same timeframe.
In addition: “the cost-effectiveness of [youth] anti-obesity interventions have likely been underestimated.” (Biener et al, 2017)
Reduced incidence of obesity based on reducing growth rate of child obesity, so that child obesity % at each age/grade decreases below recent levels typical for this population.
Disease prevalence & costs tend to increase substantially as children age, so cost savings increase as well.
In brief, high levels of MVPA among children reduce health costs by est. $30-50/child/year among elementary students, & more among middle- & high-school students. (As with costs, cost savings per student are calculated as an average across all students, not just those with health conditions, since most students are at-risk and the program is implemented across all students.)
Analysis based on peer-reviewed journal articles & population data from government statistics/reports. (See details below and in other slides including this site’s References list on Resources pages.)
Plan-Develop-Evaluate
Evidence-based preventive P-D-E framework based on Partners for Healthy Promises, Plans for, Develops, & Evaluates continuously to ensure high levels of MVPA with an at-scale cost of $10/student/year when existing staff are used = <1 year payback, in schools with min. 60 PE minutes/week AND adequate activity levels. (P-D-E costs per student are higher at smaller scales: ~$15-30/student/year).
So it often only takes ~1-2 children per K-12 class becoming healthier to pay back P-D-E investment within 1 year. (Again: these calculations assume that existing staff are used. If PE teachers must be hired and those costs are used in the payback/ROI calculation, then payback will often happen later, in the early adult years. See other cost estimations for longer-term payback/ROI analysis.)
Nutrition at School
Reduced incidence of obesity estimated, based on reduced obesity compared to what would have been expected in that sociodemographic population at those ages. However, for bigger improvements/higher savings, some BMI reduction may have also been due to P-D-E-related higher fruit & vegetable (F&V) consumption and Obama-era increased school meal quality—not just MVPA; extra F&V and higher quality meal costs beyond what is currently offered at the school are not included in $10/child cost.
ROI Timing
Rapid payback at all grade levels particularly by reducing: Elementary: ADHD; MS/Middle School: ADHD, obesity; HS/High School: ADHD, obesity, depression/BH.
Potential longer-term ROI >10x, as health condition on-set is delayed or averted & the severity later in life is postponed & reduced, with ROI depending on number of staff added etc.
Parent Health Improvement
(Does not include expected savings from improved parent health for a subset of parents whose health behavior changes due to the program. HFUS estimates that this would roughly double immediate savings, given the much higher chronic health prevalence and costs among adults, though assuming that only 1 in 3 parents whose children are in a P-D-E school with parental components improves their health behavior.)
Other Notes & References
ADHD & depression costs vary dramatically based on type of treatment.
There is some possible double-counting of teen obesity/depression/BH savings, since obesity costs can include some depression/BH costs.
The majority of Major Depressive Episodes are untreated (SAMHSA, 2018), as are other mental/social-emotional conditions—K-12 physical activity for all students could help youth, even when they are not clinically treated. (See PA, calming & focus time, and mental health slides.)
Class size assumption: 30-35 students.
References also include Yamamoto, 2013: significant costs (& savings) can start early in life: “Chronic conditions in the young (under age 30) take a higher relative toll on that population than they do for the older population. For commercial members under 30 identified with cancer or circulatory conditions…their costs were much higher on average.”
Additional more recent studies are now available & will be included over time. They indicate even higher potential health cost savings for teens, as children age with unhealthy habits.
Other references include:
Guo, Danielson, Cogan et al, 2018: Treatment Patterns and Costs Among Children Aged 2 to 17 Years With ADHD in New York State Medicaid in 2013.
Domino, Burns, Mario, et al, 2009: Service Use and Costs of Care for Depressed Adolescents: Who Uses and Who Pays?
Gupte-Singh, Singh, & Lawson, 2017: Economic Burden of ADHD among Pediatric Patients in the US.
Korczak et al, 2017: Children’s Physical Activity and Depression: A Meta-analysis.
MACPAC, 2015: Behavioral Health in the Medicaid Program—People, Use, and Expenditures.
Ogden, Carroll, Fakhouri et al, 2018: Prevalence of Obesity Among Youths by Household Income and Education Level of Head of Household—United States 2011-2014.
SAMHSA, 2018: Key Substance Use and Mental Health Indicators in the United States.
Skinner, Perrin, Skelton, 2016: Prevalence of Obesity and Severe Obesity in US Children, 1999-2014.
Xu et al, 2018: Twenty-Year Trends in Diagnosed Attention-Deficit/Hyperactivity Disorder Among US Children and Adolescents, 1997-2016.
Above notes: Turner, 2016-24. Latest version of notes @03/03/2025
More Notes & References: see Payback Details & other slides & references on Resources page at HealthyFutureUS.org. (A more recent version of notes may be in most recent HFUS slides.)